

Reports
ROAS and cost per sale by campaign, ad set and ad
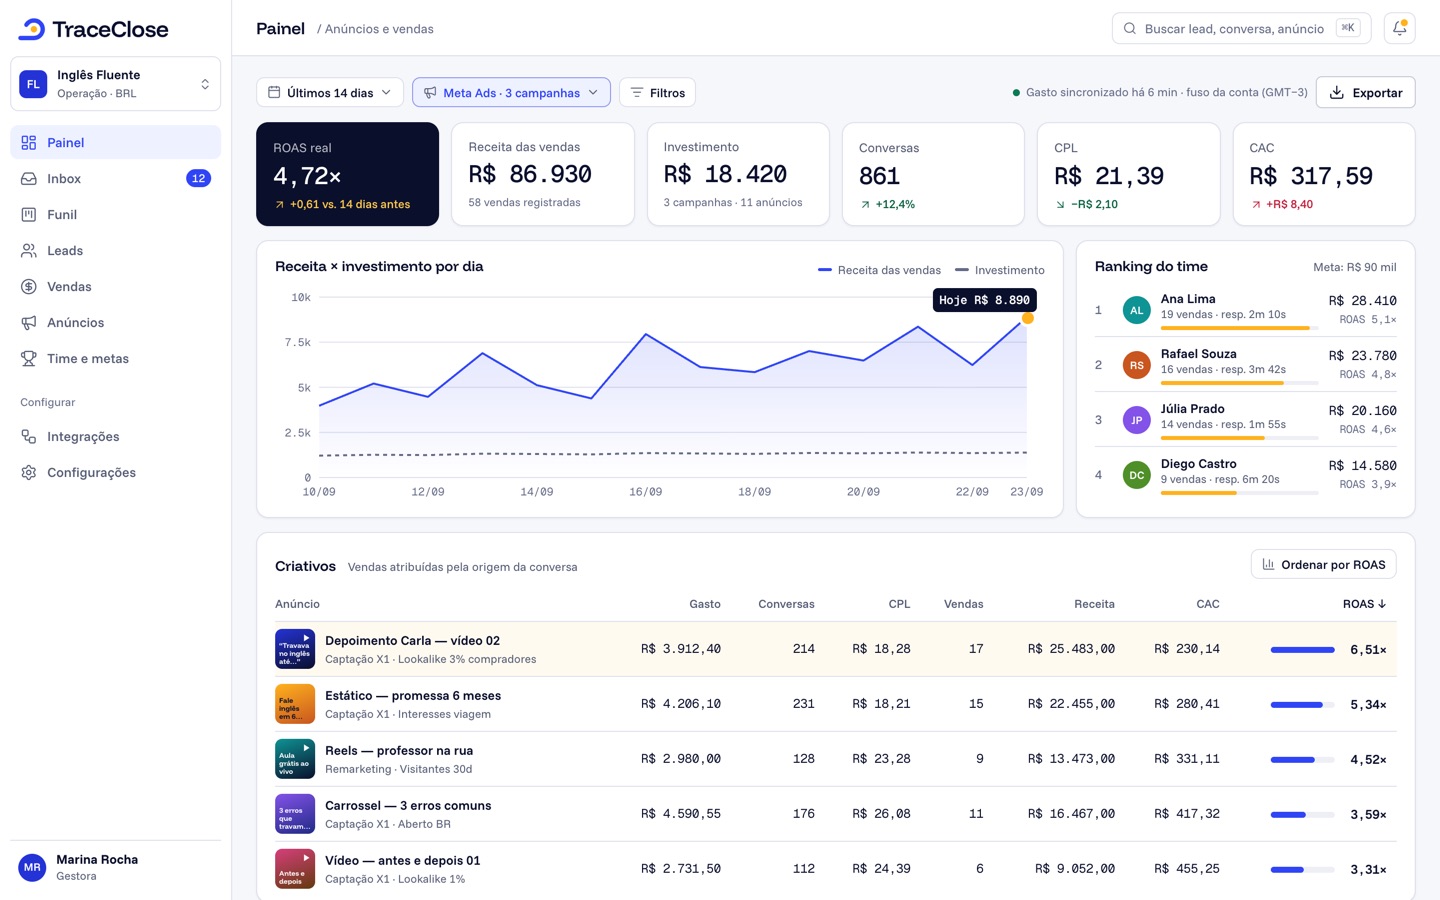
ROAS = Revenue ÷ Spend: revenue is the sales your team recorded (minus canceled ones) and spend is what you spent on Meta. Cost per sale shows up as CAC or Cost per win: Spend ÷ wins. All of it by account, campaign, ad set and ad in Analytics › Campaigns.
The formulas
Every number in the dashboard has a help icon with its formula. The main ones:
| Metric | Formula |
|---|---|
| ROAS | Revenue ÷ Spend |
| ROI | (Revenue − Spend) ÷ Spend |
| Profit | Revenue − Spend |
| CAC / Cost per win | Spend ÷ wins |
| CPL | Spend ÷ paid leads |
| Cost per meeting | Spend ÷ meetings held |
| Cost per conversation | Spend ÷ conversations started |
| Average ticket | Revenue ÷ sales |
- Revenue: the total of recorded sales that weren’t canceled, in the reporting currency.
- Wins: leads that entered a won stage of the funnel for the first time. A lead with two sales counts as one win and two sales.
- Paid leads: leads with the Paid traffic source that came in during the period. CPL uses only these, not organic ones.
- Conversations started: the number Meta reports, within its own attribution window.
Example (sample data)
One of Example Co.’s ad sets spent $1,000 in the month and brought in 40 paid leads, 8 meetings held and 5 wins, with sales adding up to $4,500:
- CPL = 1,000 ÷ 40 = $25
- Cost per meeting = 1,000 ÷ 8 = $125
- CAC = 1,000 ÷ 5 = $200
- ROAS = 4,500 ÷ 1,000 = 4.50
- Profit = 4,500 − 1,000 = $3,500; ROI = 3,500 ÷ 1,000 = 350%
- Average ticket = 4,500 ÷ 5 sales = $900
Profit here means revenue minus ad spend. Product costs, taxes and commissions aren’t part of the calculation.
Where to see each number
- Analytics › Overview: the 24 metrics for your business, with comparison and trends. See Analytics Overview.
- Analytics › Campaigns: ROAS and CAC for each account, campaign, ad set and ad. The Revenue, ROAS, ROI, Profit and CAC columns are in the Columns picker (the Essentials view doesn’t include them).
- Analytics › UTM and links: revenue by UTM and by tracked link.
Cohort or Event date changes the revenue
With the Cohort reading (the default), revenue is the sales from leads that came in during the period, up to today. With Event date, it’s the sales dated within the period. Spend always follows the date the ad ran. To judge a campaign, cohort is usually the fairest. Details in Cohort or Event date.
Didn’t work? See…
- ROAS is empty: with no spend in the period there’s nothing to divide by; check that the ad account is connected and synced (ad spend isn’t showing).
- Revenue is lower than expected: sales in another currency aren’t added in (currencies and time zone) and canceled sales are removed from revenue.
- Revenue is higher in the Overview than on the Campaigns screen: with no filter, the Overview includes sales from organic leads; the Campaigns screen only counts paid traffic.
Frequently asked questions
Why is TraceClose’s ROAS different from Ads Manager’s?
Ads Manager estimates based on the events it receives. TraceClose uses the sales your team recorded, with the real amount, linked to each lead’s source ad.
How do I measure ROAS for a messaging campaign?
Connect your Meta account, record sales with an amount on the lead and check the ROAS column in Analytics › Campaigns. The source of conversations from click-to-WhatsApp ads comes in the message itself.
Are CAC and Cost per win different?
No. Both use the same formula: spend ÷ wins.
See the path from ad to sale in your WhatsApp.
Try TraceClose free for 7 days with your team. No card needed to try.